Is the Permanent Portfolio Broken?
How to fix three major risks of the permanent portfolio.

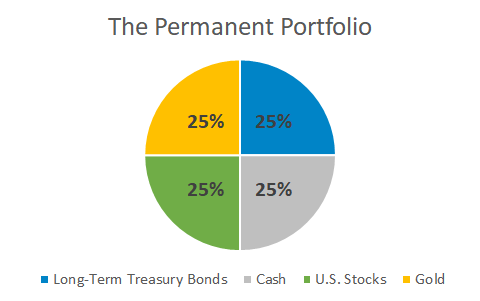
I want to like the permanent portfolio. It’s a simple low-cost strategy with an excellent track record. In a nutshell, the portfolio is an equal mix of four assets designed to perform in all economic environments.
Unfortunately, future performance is guaranteed to be lower due to the strategy’s construction.
This post explains what’s wrong with the permanent portfolio and proposes three solutions.
Treasury Bonds
This is the main part of the strategy that will behave differently in the future.
Harry Browne created the permanent portfolio in 1982 when 30-year Treasury bonds yielded 11%. Since then, 30-year bonds have almost matched the performance of stocks – an incredible feat for a investment with zero credit risk.
But what will these bonds earn going forward? A bond’s current yield is an accurate predictor of its future return:
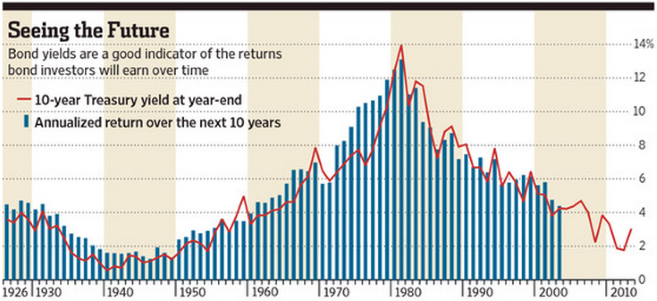
The 30-year Treasury bond now yields 1.6%, so that’s a fair estimate for what it will earn over the next few decades. This low yield comes saddled with high interest rate risk. For example, if a 30-year bond’s yield rose from 1.6% to 3.6% its price would fall 37%. This post contains more info on the risks of Treasury bonds in 2020.
So what’s an investor do if they want the safety of bonds, less interest rate risk, and some yield? That’s the question every retiree in 2020 is trying to answer. One option is an actively managed bond fund.
I’m a huge fan of passive stock ETFs. Their active counterparts rarely outperform passive funds over time, mainly because 1.3% of stocks are responsible for all stock market gains over the last three decades. It’s tough to pick the next AAPL or AMZN, and high fees of active stock funds make it an even harder mission.
But the bond world is different. Active bond managers tend to outperform passive bond indexes:
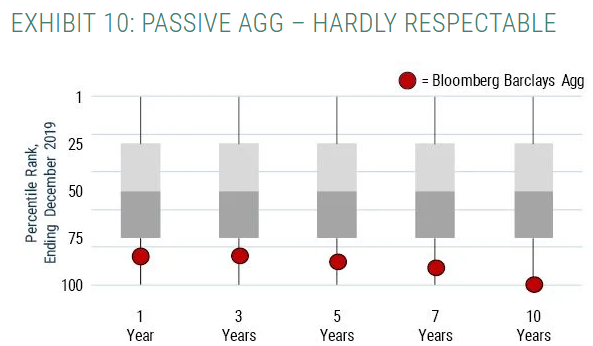
Michael Mauboussin has a great piece on why this is the case. There are hundreds of active bond funds but only a few meet the below criteria for the permanent portfolio:
- Low cost. Fund fees are the strongest predictor of performance and the rest of strategy is implemented with low cost funds.
- Low to moderate interest rate risk. A fund with long-term bonds would carry similar rate risk as the original Treasury allocation.
- Low to moderate credit risk. This part of the permanent portfolio is for periods of economic weakness. Something like high-yield corporate bonds would fall in tandem with stocks in a recession.
Here’s a list of bond funds that meet those requirements. P.S. If you’re investing in a taxable account, consider muni bonds. Traditional bond funds generate interest that is taxed at high ordinary income rates.
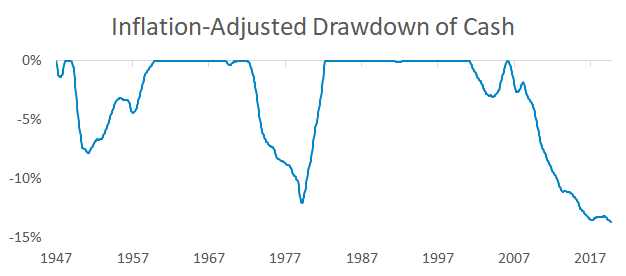
Cash
Cash is perfect for a short-term emergency fund but makes less sense for a long-term portfolio.
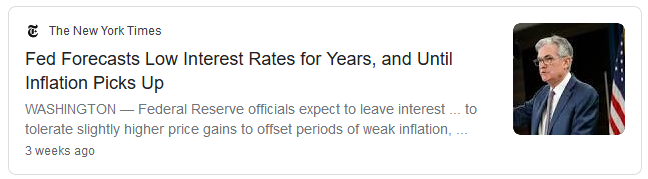
I wish investors in 2020 could sit in cash and earn a high risk-free return. But yields today are a shadow of what they were when the permanent portfolio was created in 1982. The Fed is also clear they’ll keep rates at zero for years:
Cash is a melting ice cube if short-term rates don’t compensate for inflation:
Treasury inflation-protected securities (TIPS) didn’t exist in 1982 and they’re a compelling alternative to the permanent portfolio’s original cash holding. The value of a TIPS bond adjusts higher with inflation and TIPS are guaranteed by the U.S. government.
Some readers might point out that this part of the permanent portfolio is designed for deflation. TIPS can protect against deflation too:
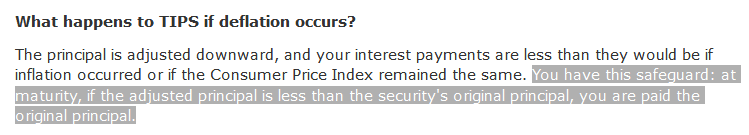
I would use short-term TIPS since they’re closer in nature to the original permanent portfolio’s cash allocation. This post contains more info on how TIPS work and the funds I use.
Stocks
The original permanent portfolio called for a 25% allocation to U.S. stocks. For most of the time since 1982, this was exactly the right stock allocation since U.S. companies outperformed.
But is it reasonable for a permanent portfolio to only own stocks from one country? It would have been difficult to predict the rise or fall of any of the below markets:
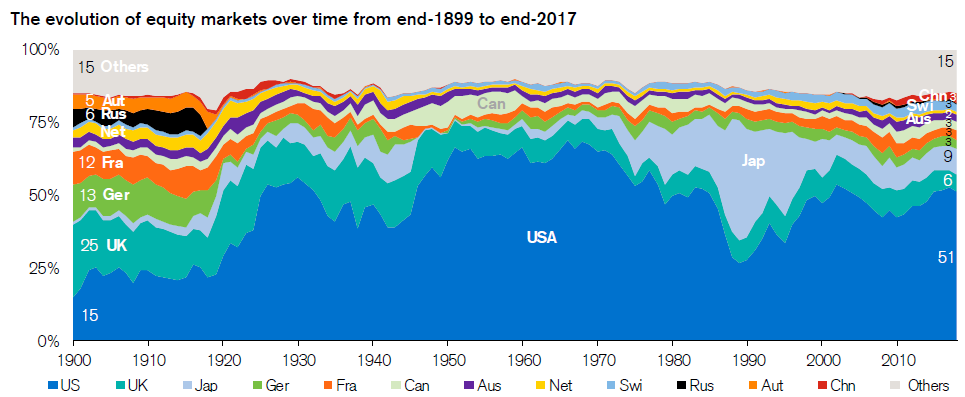
How to split exposure between U.S. and international stocks is a constant point of debate. There are 11,000 posts on the Bogleheads forum on this topic. To save you some reading time: nobody knows the best mix because nobody can predict the future.
One solution is to own a single globally diversified stock fund. Vanguard’s VT does this and its allocation mirrors the above chart.
Gold
Gold is a polarizing investment and I used to be partial to it. I rode the last gold bull market in 2010 and started a company with the profits. This was luck, not skill. Nowadays I’m neutral on gold. I don’t think it’s a holy grail nor do I think gold is an overpriced rock.
Unlike the rest of the permanent portfolio, I wouldn’t change the original 25% in gold. This part of the strategy is meant for periods of currency weakness, and few assets can hedge that risk like gold. I do think gold investors need to keep two things in mind.
First, gold’s inflation protection can take a long time to materialize. One ounce of gold buys a similar amount of goods that it did thousands of years ago. Investor time horizons are measured in decades, not centuries. Gold lost 80% after inflation from 1980 to 2000:
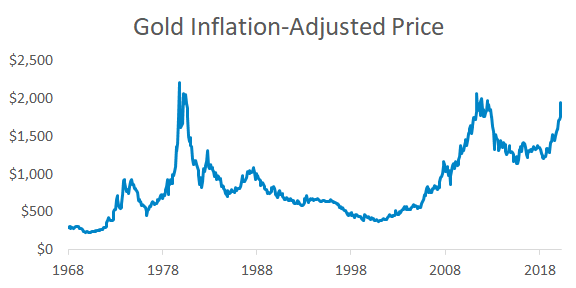
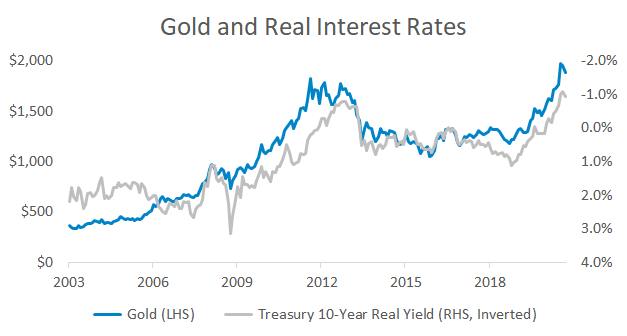
Second, gold is tethered to real interest rates. Gold doesn’t generate income so it’s sensitive to what other investments yield.
Which scenario do you think is better for gold: when banks offer a 5% return on cash net of inflation (like in 1982) or when yields are zero and inflation is 1% (like now)? This year’s drop in rates lowered the opportunity cost to owning gold:
If you buy physical gold, go for bullion from a dealer charging as little over the spot price as possible. If you buy gold ETFs, skip the popular GLD fund. It charges 0.40% and there are plenty of lower-fee funds.
Summary
The original permanent portfolio looks great in the rear-view mirror. When you see stellar returns you have to ask “What led to this performance?” The permanent portfolio was lucky because it concentrated stock investments in the U.S. and owned long-term bonds during a multi-decade collapse in rates. For investors following this strategy, this post introduced three adjustments to ensure a portfolio stays permanent regardless of what the future holds.