Measuring the Tax Drag of Trend Following

The goal of this post is to put concrete numbers on the tax impact of trend following strategies in taxable accounts.
I tested 12-month and 6-month trend strategies from 1998 to 2019 on three stock index funds:
- U.S. stocks with Vanguard’s VTSMX (ETF equivalent is VTI)
- International stocks with Vanguard’s VGTSX (ETF equivalent is VXUS)
- Emerging stocks with Vanguard’s VEIEX (ETF equivalent is VWO)
Each strategy moves to cash at month-end if the absolute momentum of the fund is less than cash. Cash returns were zeroed out for tax simplicity. The return numbers below might seem low – this is because bonds weren’t used when out of the market. This isn’t a big issue since I’m trying to isolate the tax impact of the trend entry/exit signals, not the tax impact of the out-of-market asset. All analysis was performed with Portfolio Visualizer.
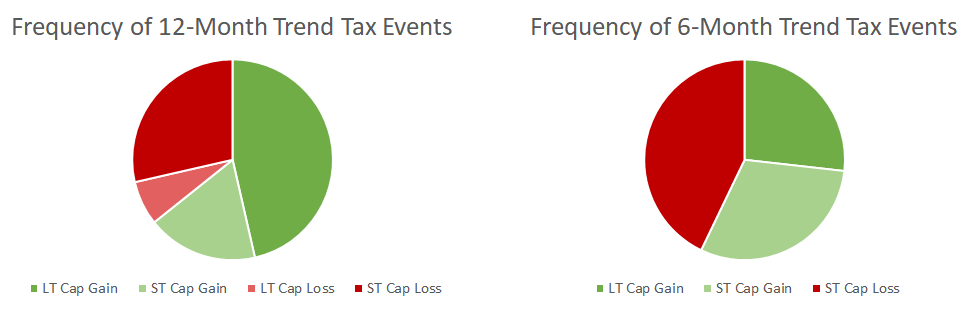
The charts below show the frequency of tax events across all three funds. There was a higher frequency of long-term capital gains in the 12-month strategy. The relative $ value of long-term to short-term capital gains was predominately long-term in both strategies.
I considered two types of investors: one with high income in a state with high income taxes, and one with average income in a state with no income taxes. Data for the high income investor also includes the 3.8% Medicare tax on net investment income. The historical analysis is based off of current tax rates, so the tax impact was likely a bit higher in the past.
| Investor Type | Federal | State | Medicare |
|---|---|---|---|
| Low Tax Rates | 22% | 0% | 0% |
| High Tax Rates | 37% | 10% | 3.8% |
Tax Drag Calculation: Let’s say U.S. stocks returned 8% in a year with a dividend yield of 2.0% and all dividends were qualified. The low tax investor is in a bracket that would pay 15% on qualified dividends. 15% of 2.0% is 0.3%, so the investor earned 7.7% after tax. The tax drag was 3.75% (0.3% / 8.0%) of the pre-tax return.
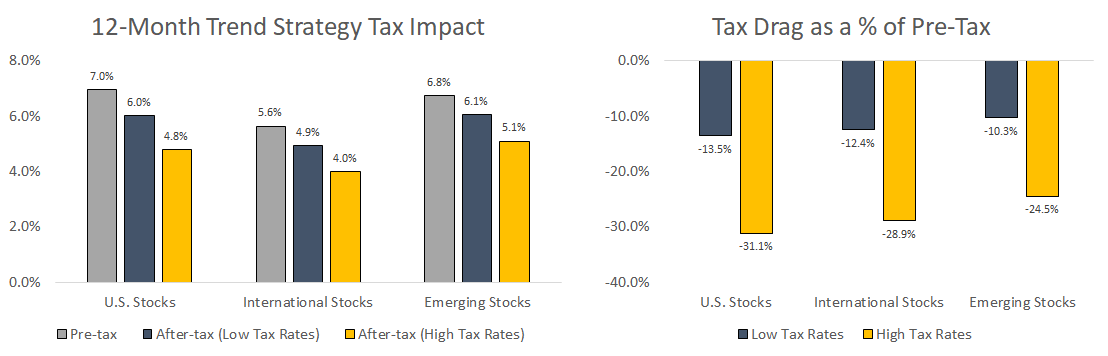
I went through each individual trend strategy trade and classified it based on its tax rate. The charts below show the tax drag of the 12-month trend strategy.
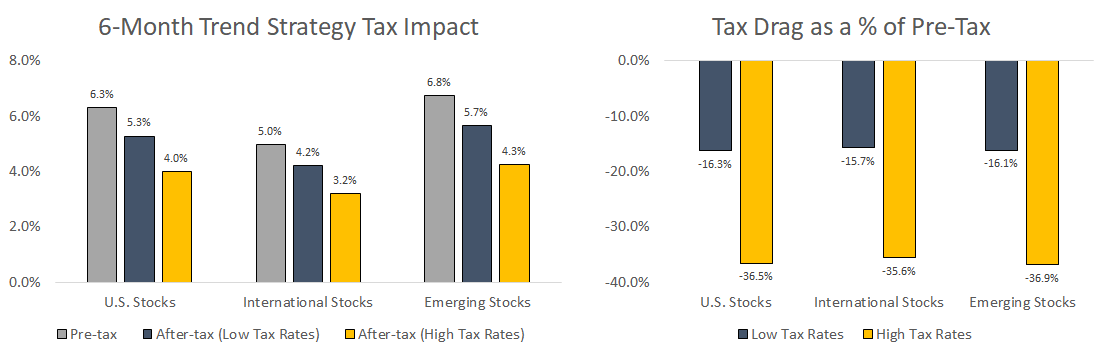
Here’s data for the 6-month trend strategies. The tax drag is higher across the board.
Summary
Three main takeaways:
- Relative to other active strategies, trend following is tax-efficient in the sense that most of its capital gains are long-term.
- Low income tax rates? Trend strategies don’t result in a huge tax impact.
- Large trend allocations can translate to a substantial tax drag for high income investors. This isn’t a problem if you have tax-deferred accounts you can shelter the trend allocation in.