The True Cost of Hedging S&P Downside
Hedging sounds like a smart thing to do. But has it actually worked? This post examines the historical costs and benefits of hedging stock exposure with SPY puts.

Hedging sounds like a smart thing to do. But has it actually worked? This post examines the historical costs and benefits of hedging stock exposure with SPY puts.
Interest in hedging strategies tends to increase as market volatility rises. There are many ways to hedge, and a common method is to overlay SPY puts to protect existing stock exposure. Being long a put option offers limited downside and unlimited upside, but this attractive payoff profile comes at a cost since traders are (mostly) smart and price options accordingly.
Hedge Structure
The data in this post covers three types of hedge structures: 10% out-of-the-money (OTM) puts, 20% OTM puts, and 30% OTM puts. Options are rolled on the last trading day of each quarter based on the nearest SPY strike interval of 5. For example, on 3/29/2018 (end of Q1) SPY closed at $263.15. An exactly 10% OTM price would be $236.84. The closest strike interval of 5 was $235. This rounding is done to use more liquid strikes.
Each option originally has six months to maturity. For example, on 3/29/2018, the 9/28/2018 expiration would be used for the next quarter. Then at the end of Q2 on 6/29/2018, SPY was trading at $271.28. The old 9/28/2018 $235 put would be rolled to a new 12/31/2018 $245 put, with a new six month maturity and adjusted strike price. Data in this post ranges from April 2007 to December 2018. April 2007 is the start of my dataset and this 11-year period captures a full recession and expansion market cycle.
Hedge Risk and Return
The first graphs show the compound return and max drawdown for a 2.5% allocation to the three structures. This 2.5% is reset every quarterly roll. For example, if at the end of a quarter the SPY allocation drifts to 99.0% and the hedge is 1.0%, the percentages are rebalanced to 97.5% and 2.5%.
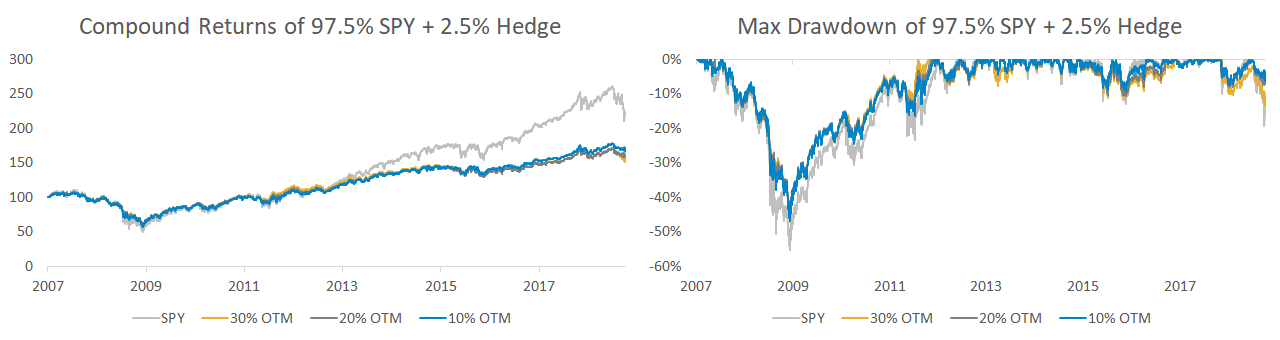
The main takeaway of the above chart is that the strike distance doesn’t really matter. Markets are mostly efficient – after the 1987 crash traders have bid up the implied volatility of distant OTM puts (well beyond what Black-Scholes would suggest) to reflect the fact that tail risks do occur and stock market returns are not normally distributed.
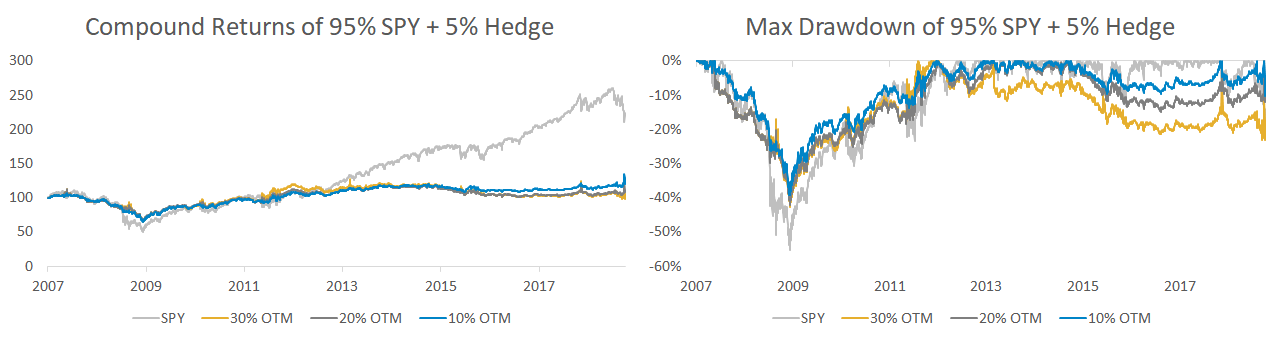
The graphs below show the same structures as above, but for a target quarterly allocation of 95% in SPY and 5% in the hedges.
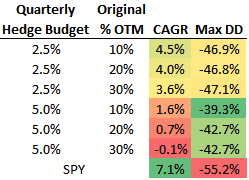
This table shows the cumulative CAGR and max drawdown data for all structures and allocation amounts since April 2007.
Annual Impact
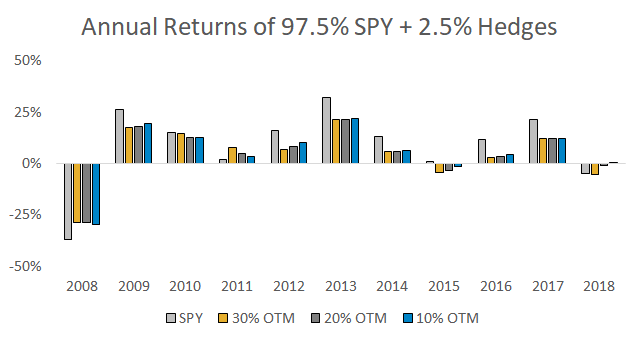
The chart below shows the differences in annual performance between the 2.5% hedge structures and a 100% long position in SPY.
Same data but for the 5.0% hedge structures.
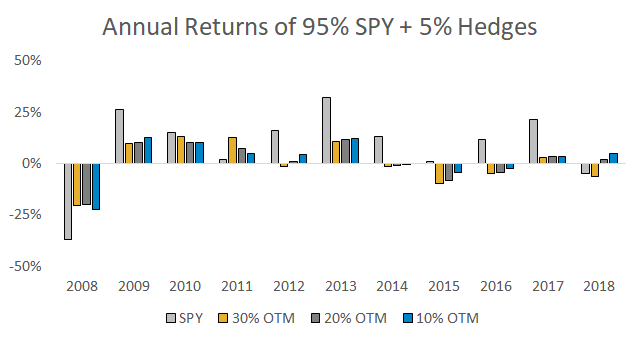
Seemingly small hedge amounts can translate to drastic underperformance in strong markets. Especially if a year is a steady grind higher like 2013. A 5.0% hedge budget in 2013 was evaporated each quarter, translating to a cumulative -20% annual drag compared to a 100% SPY position.
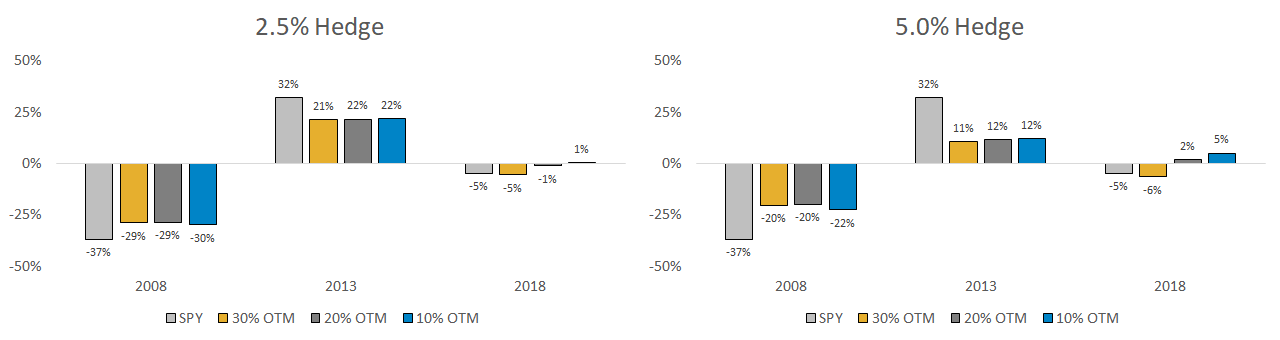
2008 was the ultimate year to have a hedge, 2013 was the opposite with SPY rising more than 30%, and 2018 was an in-between year with substantial volatility but only mildly negative SPY performance. Here’s how each structure and budget did in those years.
Hedging Based on VIX
Some investors think hedging isn’t suitable for all market environments, but rather only when certain criteria is met. For example, a popular argument is “volatility is low, hedges are cheap, so buy some puts”. It sounds intuitive, but has it worked?
The graph below shows the 97.5% SPY and 2.5% budget 10% OTM hedge from above, and then a version where the hedge is only used if the prior quarter’s closing spot VIX value was less 15. This isn’t a cherry-picked number – it’s just a simple level that I think most would consider low volatility. When spot VIX is > 15 the hedge is not used and the portfolio is 100% long SPY.


The volatility filter underperformed the constant hedge during the financial crisis since spot VIX was well above 15 when markets crashed. But the filter did help a bit since 2013.
There are two issues with this filter approach. One, low volatility can persist for a long time. Two, seemingly high implied volatility (like a spot VIX of 30 in September 2008) sometimes ends up being cheap relative to future realized volatility.
Hedging Based on Valuation
What about using a valuation filter and only hedging if stock valuations are high? One portfolio below applies the 2.5% quarterly budget 10% OTM hedge when CAPE is above 25, otherwise it’s 100% long SPY.


Similar issues to the volatility filter. High valuations can persist for longer than anyone thinks possible. And if a true market crash occurs, valuations will likely go substantially past fair value before prices eventually bottom.
Results During Recent Corrections
The table below summarizes data on the different hedging approaches during the four biggest stock drawdowns since 2007.
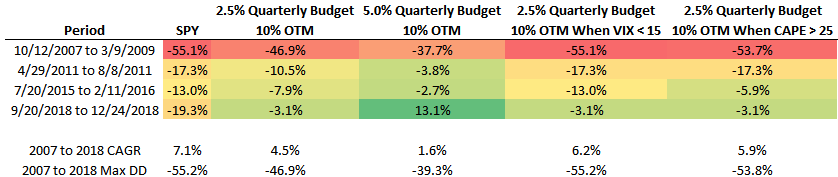
A larger 5.0% hedge budget resulted in smaller losses, but at the expense of dismal full cycle performance. The VIX and CAPE filters did improve returns relative to a constant hedge, but they both failed to protect investors from losses in 2008 and 2011.
Summary
Some takeaways of the above data:
- Different OTM strike selection doesn’t result in vastly different outcomes for long put positions.
- The sizing of a hedge is important. A 5% quarterly hedge budget may seem small but can potentially wipe out a year of gains.
- Hedging is typically expensive and shouldn’t be treated as a free lunch to capture stock market upside with less downside. The market is smart and makes you pay up to hedge.
I hope this post was useful and do get in contact if you have any questions.